Introduction
This blog aims to shed light on the distinction between observability and alerting, showcasing their synergistic relationship, discovering how the perfect blend of observability and alerting can serve as a potent tool for modern operations teams and enhance operational resilience for businesses. In today’s landscape of ensuring the reliability of systems and infrastructure, IT professionals often find themselves navigating the intricacies of distinguishing between observability and alerting within the broader realm of monitoring, a buzzword in the SRE culture. The post strives to simplify the essence of these two components, fostering a clear understanding of how they collaborate to create a harmonious and efficient workflow.
What is Observability?
In the Google SRE (Site Reliability Engineering) book, observability is defined as the measure of how well internal states of a system can be inferred from its external outputs. Observability encompasses the tools, practices, and processes that enable operators to gain insights into the performance, health, and behaviour of a system. This includes the ability to monitor and understand various aspects such as latency, error rates, traffic patterns, and other relevant metrics.
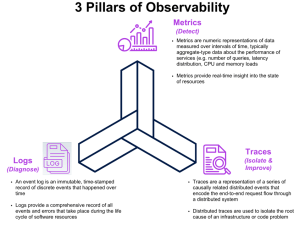
Observability is essentially having data about every component of your system, every aspect that makes up your entire infrastructure, this is referring to the threefold i.e. logs, traces and metrics which helps with proactive monitoring.
Observability is about answering the questions of how, giving engineers the ability or power to notice any irregularities that might cause a whole downtime of the system.
What is Alerting?
Alerting is the preemptive guide to help SREs to triage issues, essentially leveraging the observability metrics to and bringing to the knowledge of the engineering team all the irregularities in the infrastructure.
Let’s consider a practical real-life example in a web application. Imagine you are responsible for the reliability of an e-commerce website, and you have implemented observability practices to monitor various aspects of the system.
Observability Data:
You are collecting metrics such as response time, error rates, and database query performance.
Alerting Scenario:
If the average response time of your e-commerce website surpasses a predefined threshold, an alert is triggered based on observability data. For instance, you may set a threshold of 500 milliseconds for response time. If the observed response time exceeds this limit, an alert is generated.
Practical Use:
When the response time alert is triggered, it indicates potential performance degradation. This alert enables your operations team to investigate the issue promptly. They can utilise additional observability data, such as error rates and database query performance, to pinpoint the root cause of the slowdown. It could be due to increased user traffic, a specific database query causing bottlenecks, or other factors impacting system performance.
By using observability data for alerting, you can proactively address issues before they escalate, ensuring a more responsive and reliable user experience on the e-commerce website. This example illustrates how observability empowers you to detect anomalies and take timely corrective actions to maintain system health and performance.
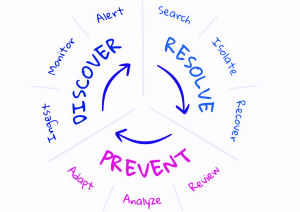
The concept of Proactive & Reactive monitoring
Proactive monitoring is like having a vigilant guardian for your digital kingdom. In this approach, your system is constantly under the watchful eye of sophisticated tools and practices designed to identify potential issues before they escalate into critical problems.
It’s the art of foreseeing challenges, allowing you to address them with precision and finesse. E.g During a website’s anticipated traffic surge, proactive monitoring detects a gradual increase in resource usage. This prompts the team to scale up servers and optimise databases, ensuring a smooth shopping experience even before users notice a slowdown.
Reactive monitoring, on the other hand, is akin to having a rapid response team ready for action. While proactive monitoring aims to prevent issues, reactive monitoring comes into play when the unexpected occurs.
It involves swift detection and immediate response to incidents that were not anticipated through proactive measures. E.g In response to an unexpected database outage triggered by a surge in queries, reactive monitoring swiftly identifies the root cause. The team dynamically scales up resources to resolve the issue, minimising downtime and ensuring uninterrupted service.
The Synergy of Observability and Alerting
When combined effectively, observability and alerting create a powerful synergy that enhances operational resilience in several ways:
Early Detection of Issues: Observability provides real-time insights into system behaviour, allowing organisations to detect issues as soon as they arise. By correlating telemetry data across metrics, logs, and traces, organisations can identify patterns indicative of potential problems and trigger alerts before they escalate.
Proactive Response: Alerting enables organisations to respond proactively to issues, rather than reactively waiting for problems to impact operations. By defining clear alerting thresholds and escalation procedures, organisations can ensure that relevant stakeholders are notified promptly when issues arise, enabling them to take corrective action swiftly.
Reduced Mean Time to Resolution (MTTR): The combination of observability and alerting helps organisations reduce mean time to resolution (MTTR) by streamlining the incident response process. By providing actionable insights and triggering alerts in real-time, organisations can expedite the diagnosis and resolution of issues, minimising downtime and its associated costs.
Enhanced Business Continuity: By proactively monitoring system health and responding swiftly to issues, organisations can ensure business continuity and minimise the impact of disruptions on critical operations. The synergy of observability and alerting helps organisations maintain a robust operational infrastructure that can withstand unforeseen challenges and disruptions.
By harnessing the insights provided by observability and the proactive nature of alerting, organisations can detect and respond to issues swiftly, minimise downtime, and maintain a robust operational infrastructure. By investing in observability tools, defining clear alerting thresholds, and fostering a culture of continuous improvement, organisations can navigate challenges effectively and ensure business continuity in the face of evolving threats and disruptions.
The perfect blend of observability and alerting is essential for enhancing operational resilience in today’s technology-driven landscape.
How bigspark can help
Choosing to invest in bigspark’s SRE services is an investment in the future success of your business. Our team consistently explores emerging technologies and methodologies, ensuring that your systems not only remain reliable today but are also equipped to confront the challenges of tomorrow. Collaborate with us to elevate your operations and empower your team to focus on innovation and sustained growth.
If you would like to know how bigspark can help you with your SRE journey, contact us now at enquires@bigspark.dev.